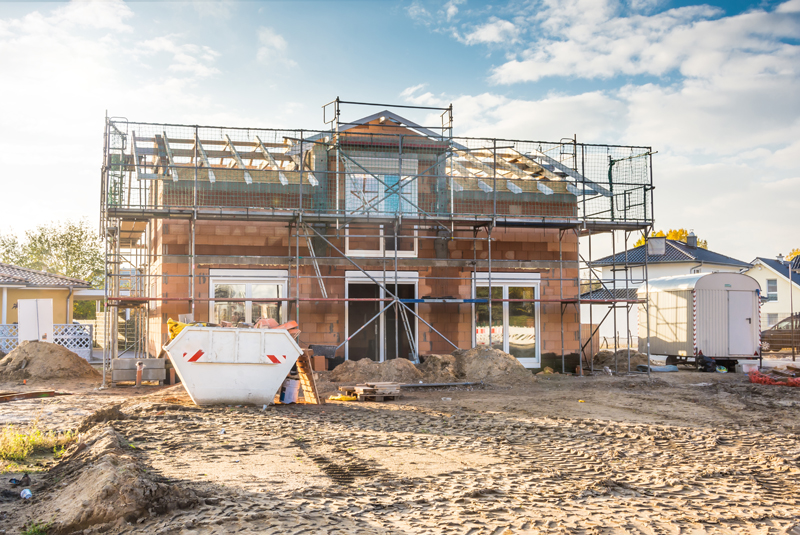
The number of new homes registered by the UK’s housebuilders and developers in the first three months of the year reached more than 37,500, reports NHBC.
This is said to be a 3% increase on the same period in 2018, where 37,672 new homes were registered to be built compared to the 36,508 built last year. The private sector was down by 6% with the affordable and rental sector up 36%.
The overall increase, despite the ongoing Brexit uncertainty, is said to be partly due to the low levels seen in the corresponding period 12 months ago when the ‘Beast from the East’ caused severe disruption on sites across the country.
The rise in the affordable and rental registration numbers reflects the continued growth in the Private Rental Sector in many UK towns and cities.
At a regional level London saw a 58% increase compared to Q1 2018, reportedly boosted by a number of large schemes being registered at the start of this year.
NHBC is a warranty and insurance provider for new homes in the UK and its registration statistics are an indicator for the new homes market.
NHBC Chief Executive, Steve Wood, said: “We are pleased to report good numbers for the start of the year, although we do need to bear in mind the situation 12 months ago when freezing conditions caused major hold-ups in registrations as well as build-rates across the bulk of the UK.
“Although Brexit uncertainties are impacting consumer confidence and causing some dampening of new-build and second-hand sale markets, housing remains an attractive asset class for inward investors, which does cause us to be more optimistic about Build to rent.
“At NHBC, we will continue to work with developers, builders and housing associations to help to improve the quality of new homes for the people who will live in them.”
Full regional breakdown of total new homes registered during this period:
| NHBC – UK Registrations by Region | ||
| England – Regions | Jan 19 – Mar 19 | Jan 18 – Mar 18 |
| NORTH EAST | 1,298 | 1,433 |
| NORTH WEST & MERSEYSIDE | 3,968 | 5,059 |
| YORKSHIRE & HUMBERSIDE | 2,511 | 2,459 |
| WEST MIDLANDS | 3,285 | 3,185 |
| EAST MIDLANDS | 2,650 | 3,460 |
| EASTERN | 3,658 | 3,800 |
| SOUTH WEST | 3,737 | 3,237 |
| LONDON | 5,625 | 3,549 |
| SOUTH EAST | 6,267 | 5,820 |
| TOTAL ENGLAND | 32,999 | 32,002 |
| SCOTLAND | 2,444 | 2,435 |
| WALES | 1,230 | 1,220 |
| NORTHERN IRELAND & ISLE OF MAN | 999 | 851 |
| TOTAL UK | 37,672 | 36,508 |
For more information, visit www.nhbc.co.uk.